
Portfolio · five apps for one investor
A folder of spreadsheets, rebuilt as five working apps.
A property investor was running the whole business out of spreadsheets: one to screen deals, one to guess a rent, one to model a short-term let, one to compare lender quotes, one to project a thirty-year hold. Each was slow, each drifted from the others, and none of them survived being handed to anyone else. Givata rebuilt them as five apps covering fix and flips, long-term, mid-term and short-term rentals, rent comps, and DSCR commercial loan modelling - sharing one workflow.
Next.js, React and Postgres · all five in use today
The trailer
All five, in a couple of minutes.
These are private tools behind a sign-in, so this is the tour. Every screen is the real software; every property, price and lender in it is invented.
Sample data throughout. No real property, market, rent or lender appears.
The workflow
Five apps, in the order a deal actually happens.
Each one was built to answer a single question well. Together they cover a property from the day it appears on the market to the thirtieth year of holding it - and because they were built as a set, the answer from one is the input to the next.
01 · Find
Is this deal worth my time?
Listings come in automatically, get screened against the investor's own criteria, and land in a pipeline with a verdict.
02 · Price
What does it actually rent for?
A market-rent estimate built from comparable rentals you can see, check and argue with.
03 · Test
Does it work short-term?
A seasonal revenue model, the real operating costs, and the cost of furnishing it before it earns a night.
04 · Finance
Which lender quote wins?
Every quote modelled to the same horizons, so the cheapest rate and the best outcome can be told apart.
05 · Hold
What does it look like in year 30?
A full pro forma, several futures compared side by side, and the whole portfolio in one view.
Screening deals one at a time in a spreadsheet caps how many you can look at, and the number that matters is how many you can reject quickly.
New listings arrive on a schedule, get run through the same analysis every time, and come back with a verdict and the reasons behind it. The investor's screening criteria live in the app rather than in their head, so every property is measured the same way whether it is the first of the week or the fiftieth.
Everything downstream - the offer, the status, the notes - stays attached to the property, which is what makes a pipeline out of what used to be a folder of files.
- Fix-and-flip and rental analysis on every property, automatically
- A verdict with its reasons, not just a score
- Screening criteria applied to every listing, re-scored when they change
- Each deal re-run against the ways it could go wrong
- Pulls Zillow listings automatically on a schedule, or one at a time by link
- Reads the listing photos with image analysis to grade the initial rehab condition, which sets the rehab allowance
- Status workflow from new through to purchased
- A closing statement can be uploaded and read into line items
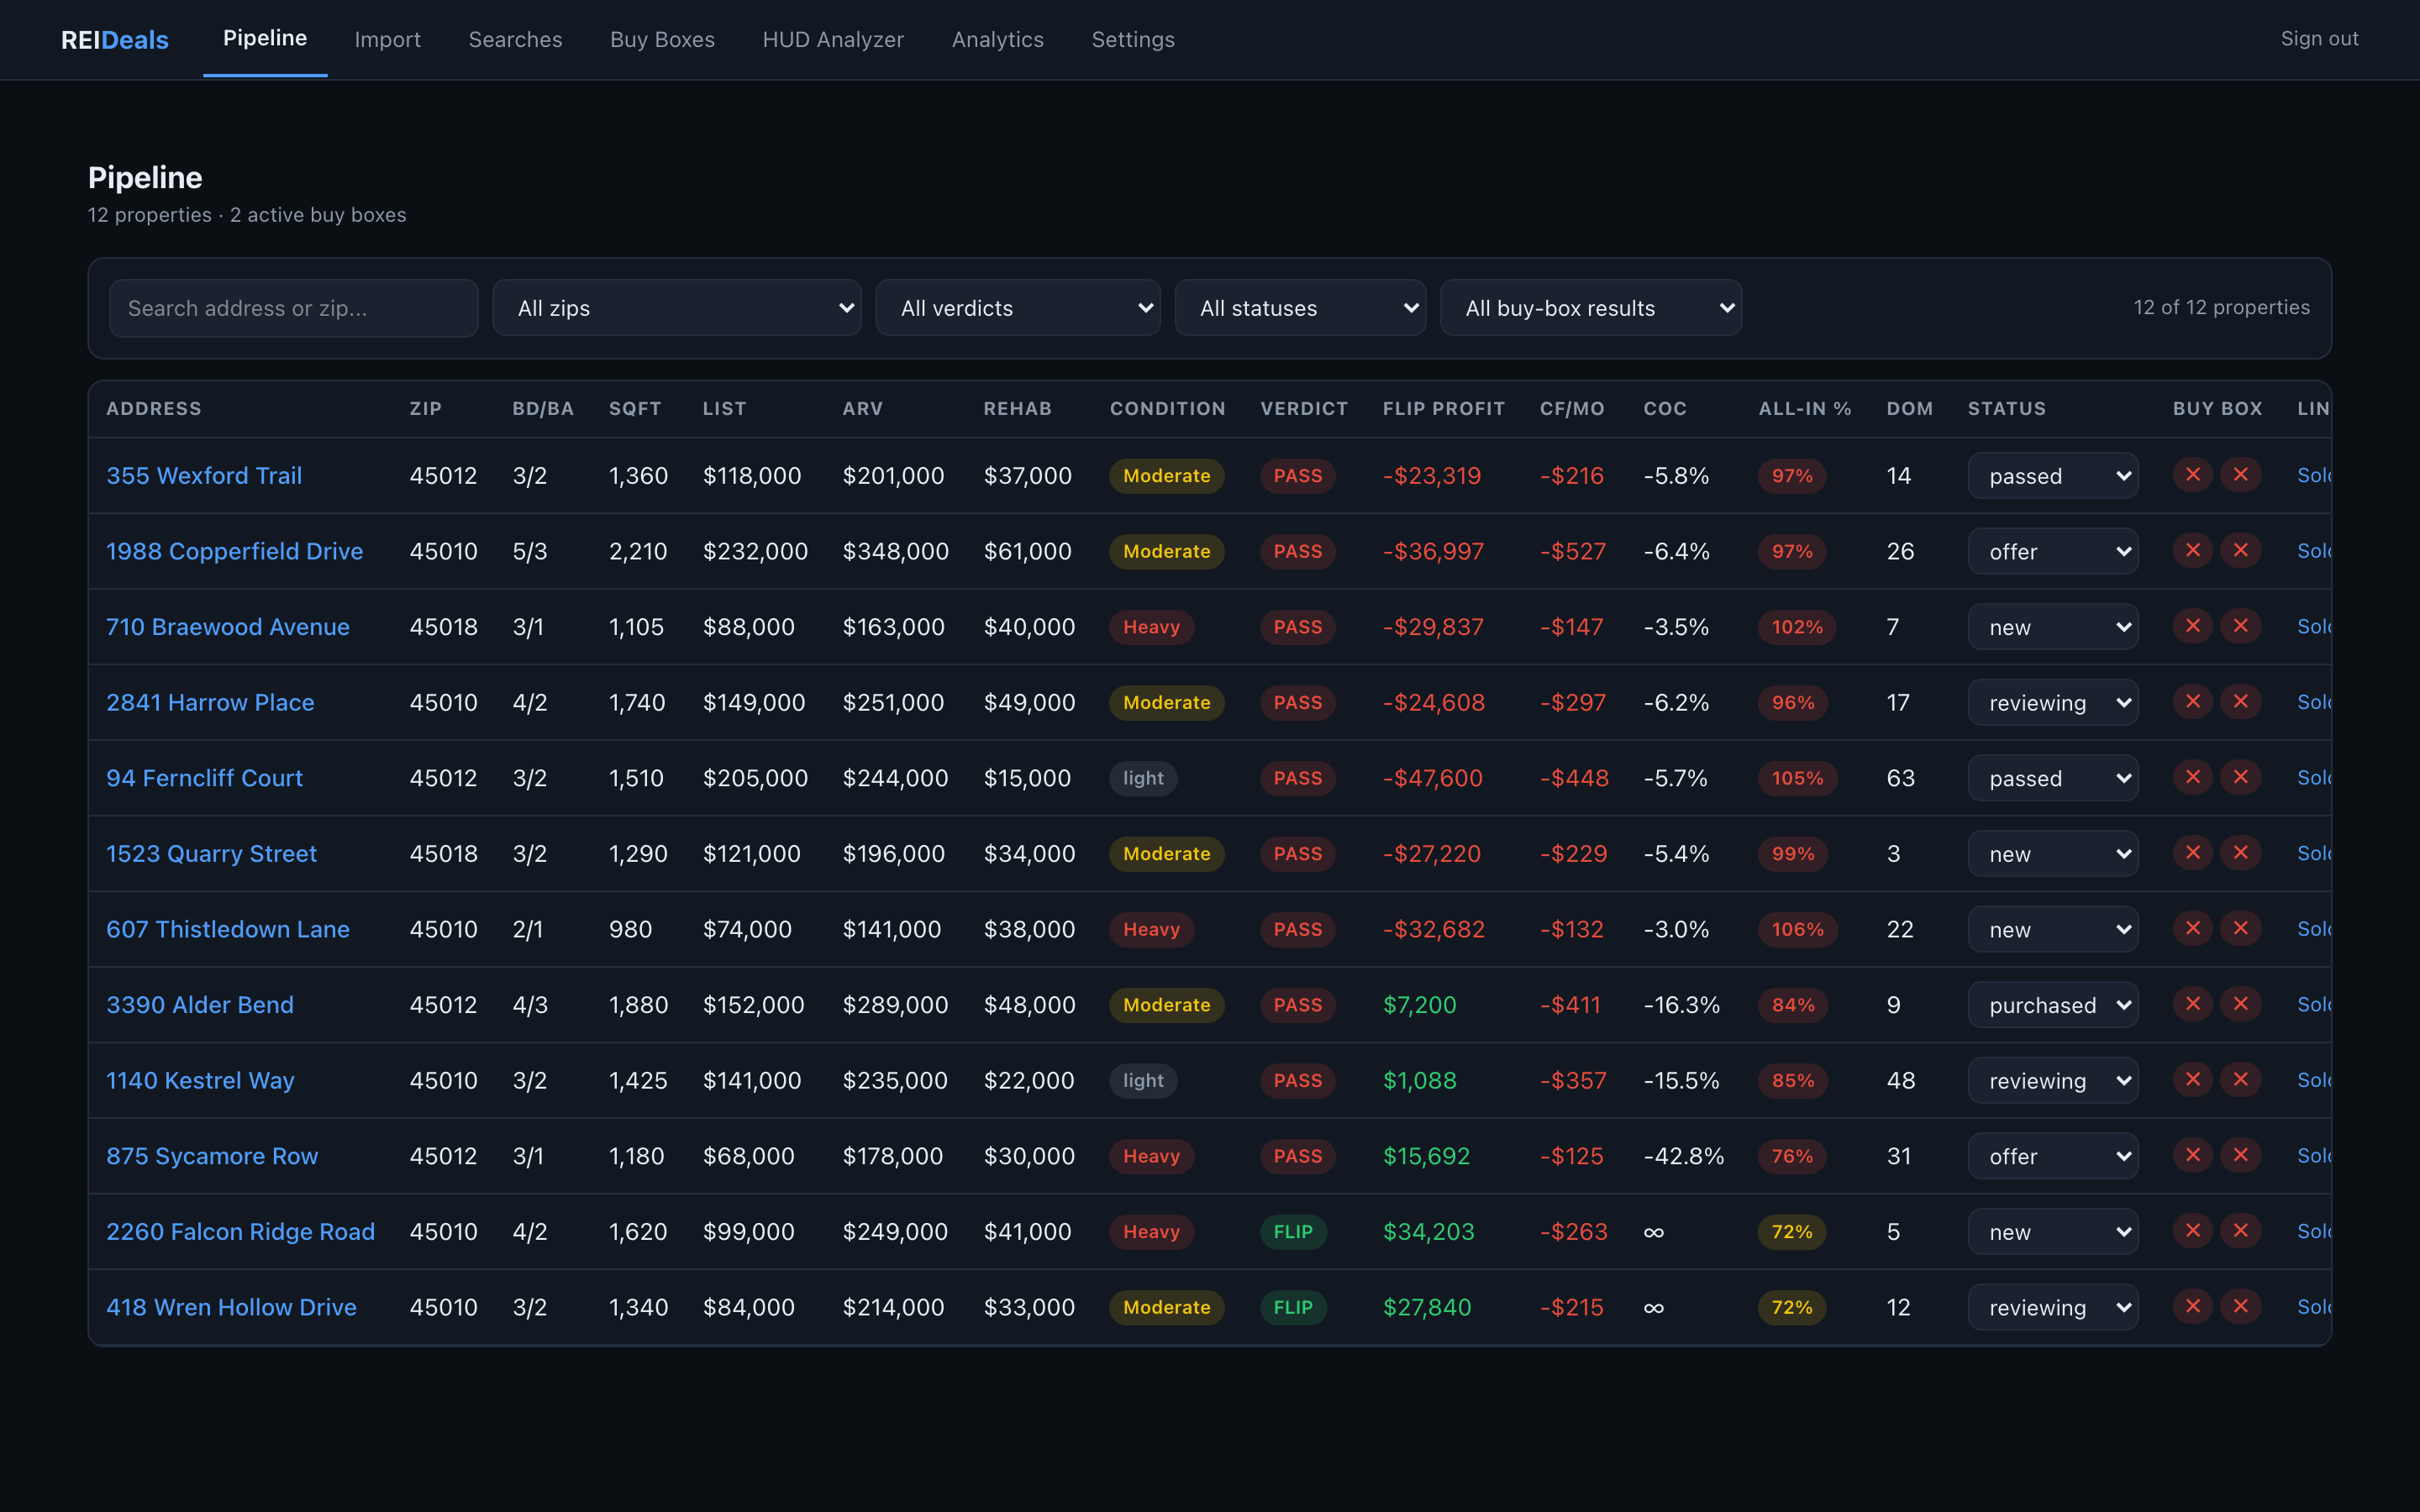
The pipeline. Twelve invented deals, most of them rejected - which is what a real week looks like.
Every projection on a rental starts with one number - the rent. Most tools hand you that number and hide their working.
This one shows the comparable rentals the estimate is built from, and lets you throw any of them out. Take away the three that are nothing like the property and the median, the percentiles and the confidence score all move in front of you. The number becomes something you can defend to a lender or a partner rather than something you have to trust.
It also says when it is unsure: a thin market, a wide spread or a search that had to reach a long way for comparables all pull the confidence down.
- An estimate for a specific address, or for an area you draw on the map
- Every comparable listed, with distance, size and similarity
- Toggle one out and the whole estimate recomputes live
- The vendor's own estimate shown beside one computed from the comps on screen
- A confidence score that flags a thin market
- The search radius widens itself until it finds enough to work with
- Rent trend for the area, saved reports, and a printable version
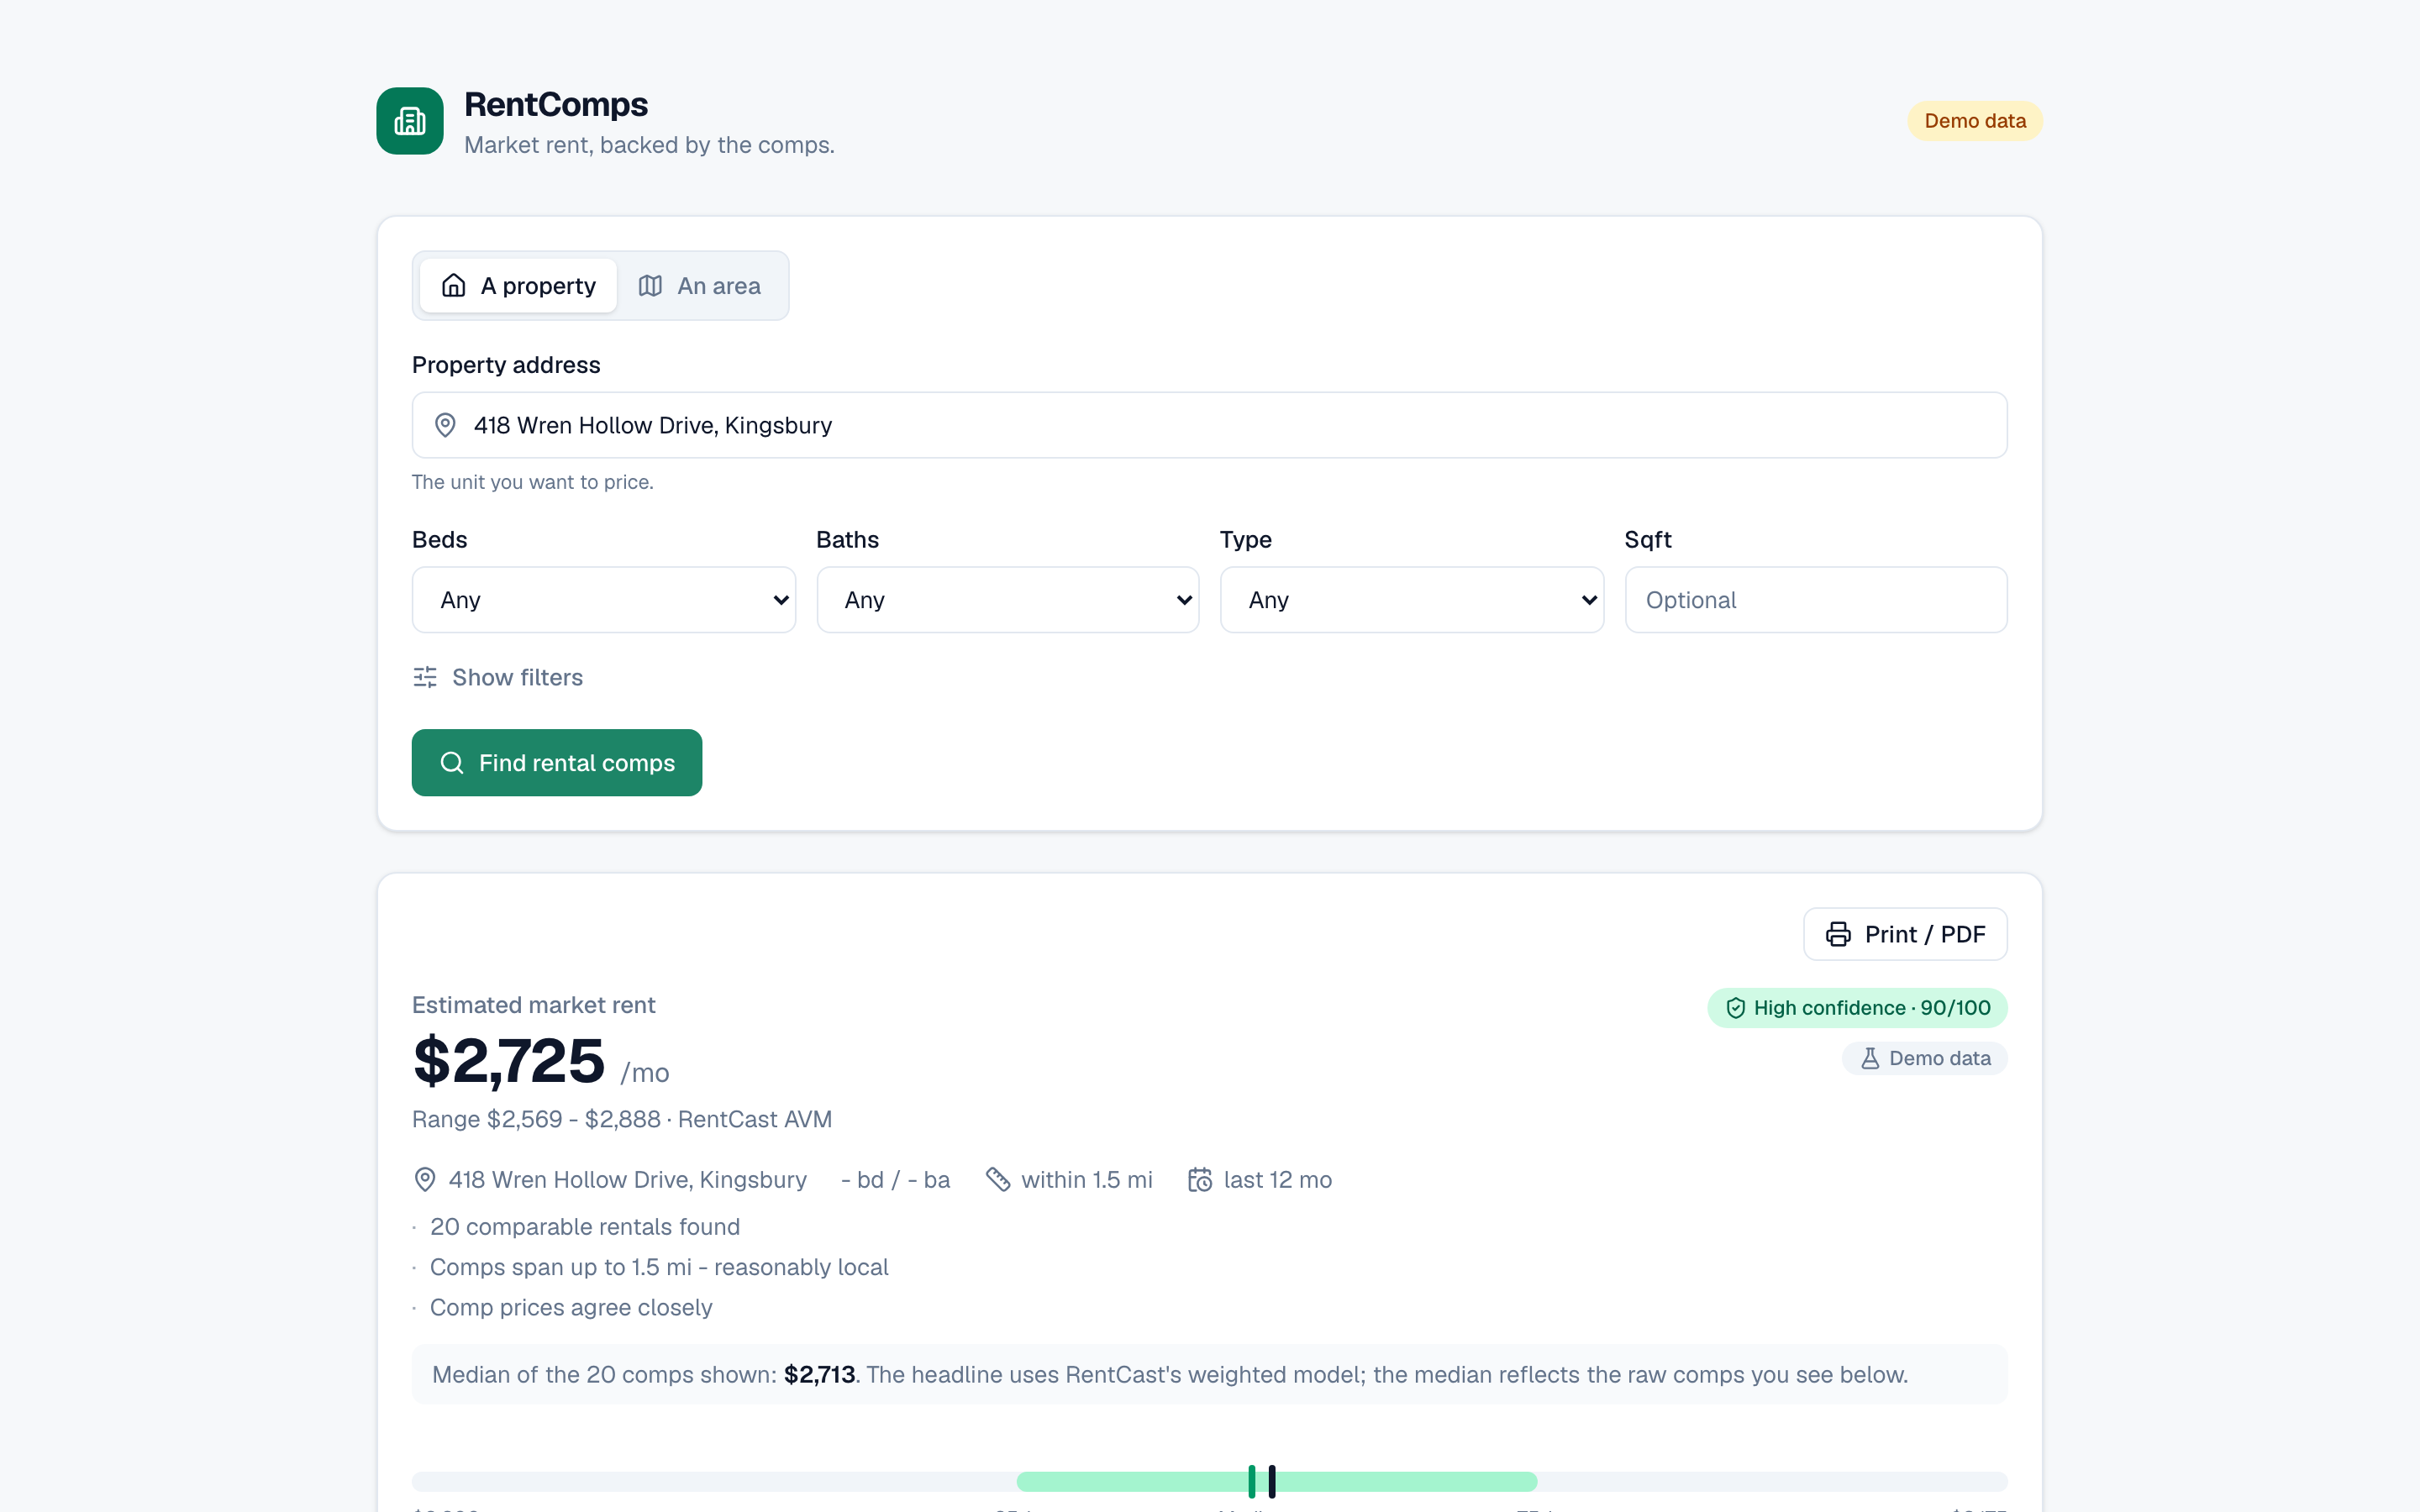
The estimate, with its confidence and comp count stated up front.
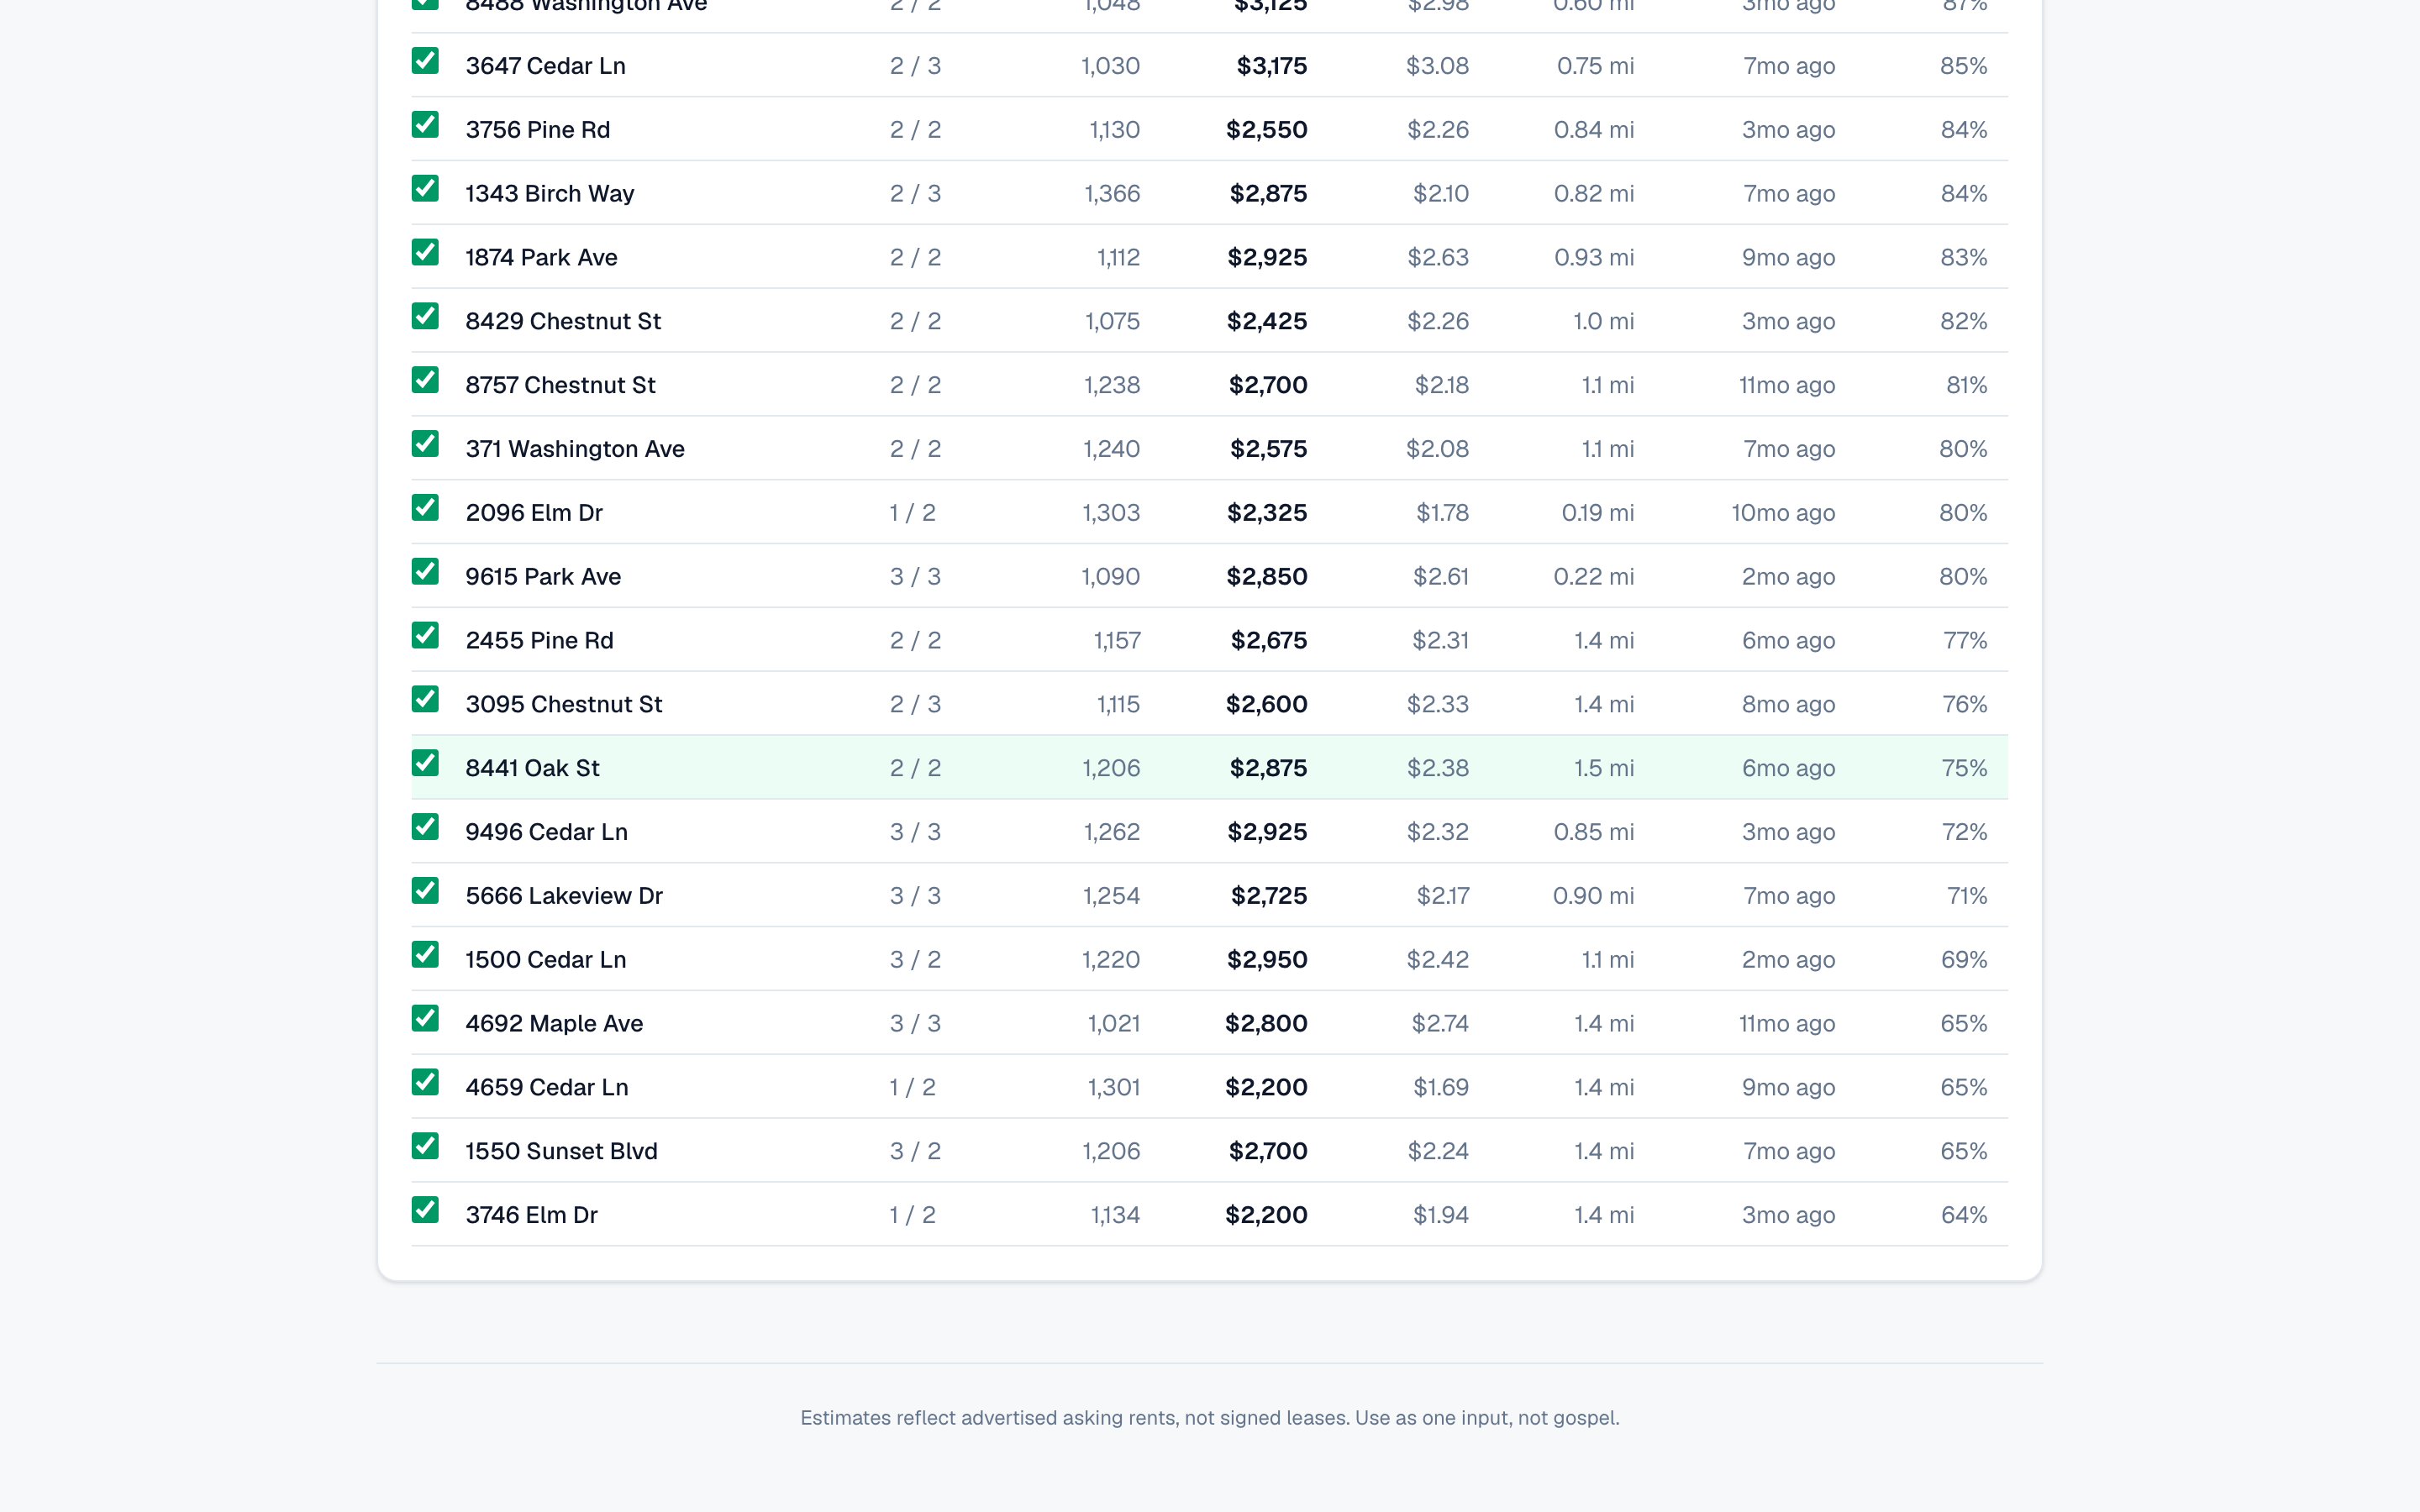
The comps behind it. Untick one and the number moves.
A short-term rental is a different business from a long-term one, and the two things that sink it are seasonality and the cost of furnishing.
Revenue is modelled month by month rather than as one annual average, because a property that is full in July and empty in February does not behave like its own yearly mean. Cleaning is passed through properly, with the number of turnovers driven by how long people actually stay.
Then there is the part most calculators ignore: the cost of making the place ready. A furnishing inventory scaled to the size of the property, priced item by item with dated prices and links, rolls straight into the cash needed to launch.
- Paste a listing link or its text and the property fills itself in
- Rate and occupancy modelled for all twelve months, with seasonality presets
- The full operating cost structure, not a percentage guess
- A furnishing inventory of around a hundred items, scaled to beds, baths and guests
- Every price dated, editable, and linked to where it came from
- A plain verdict, and a reminder to check the local short-let rules
- Works offline in the browser, with backup and restore
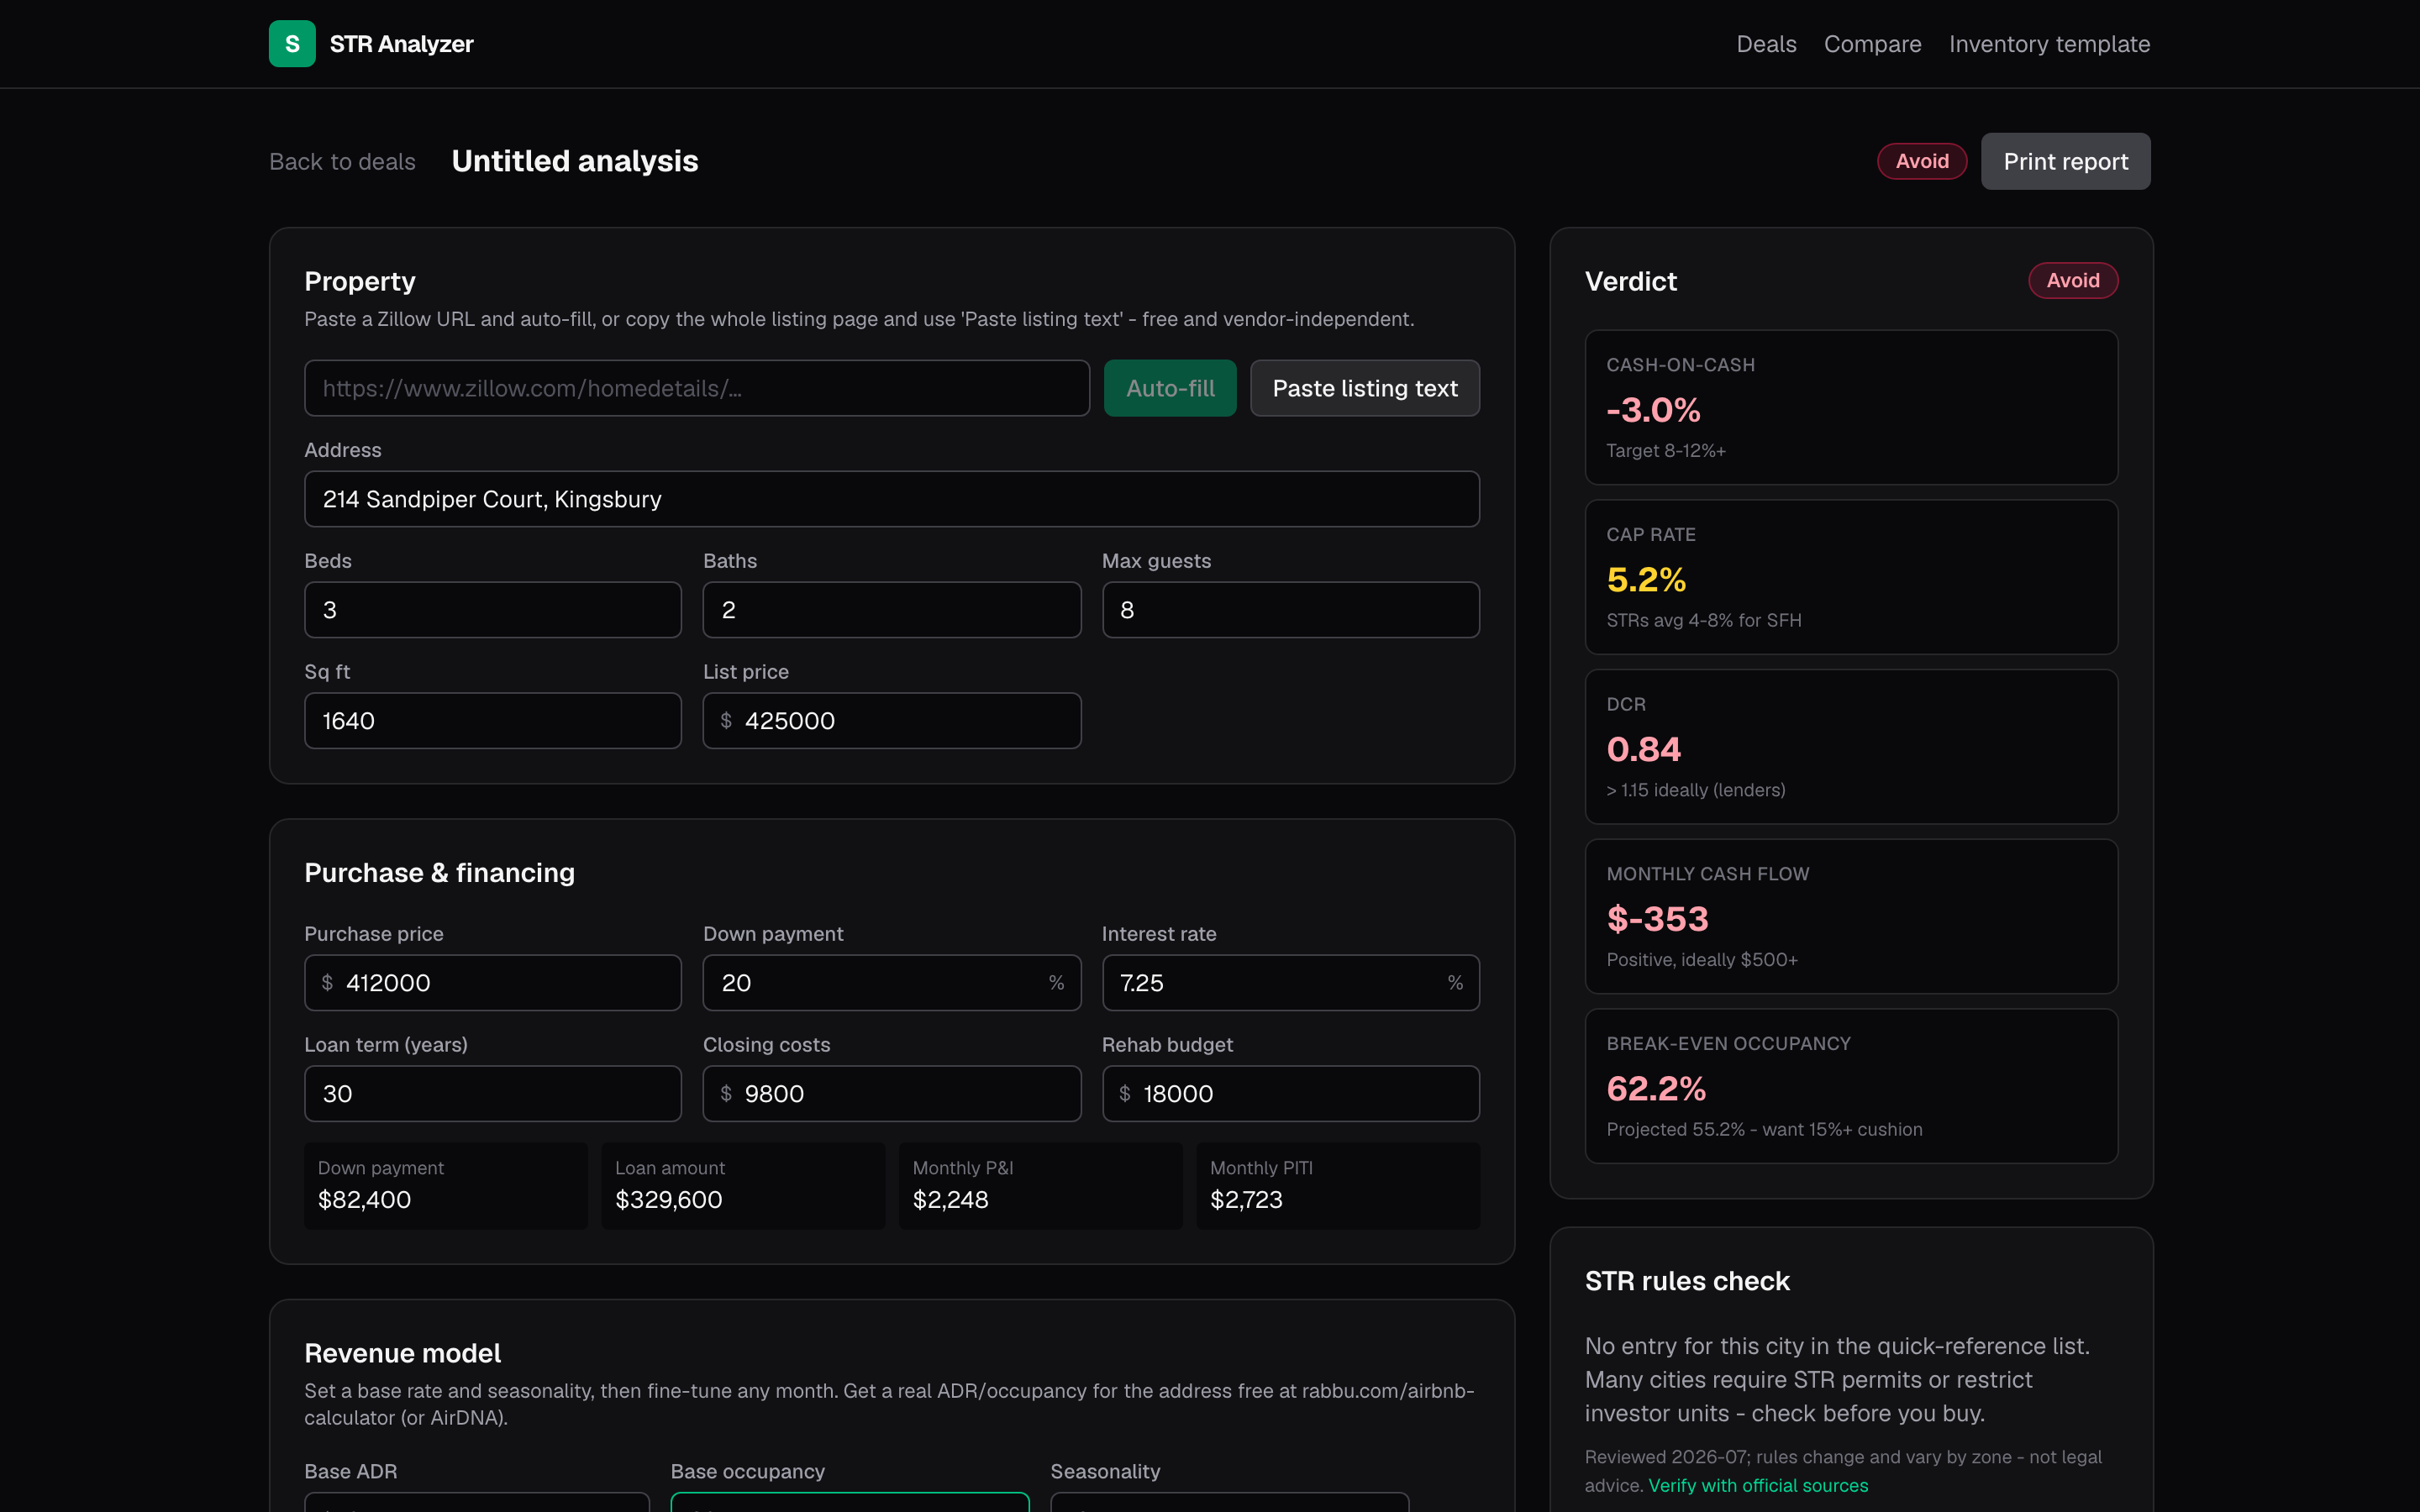
An invented property that does not work. The verdict says so, and shows which number killed it.
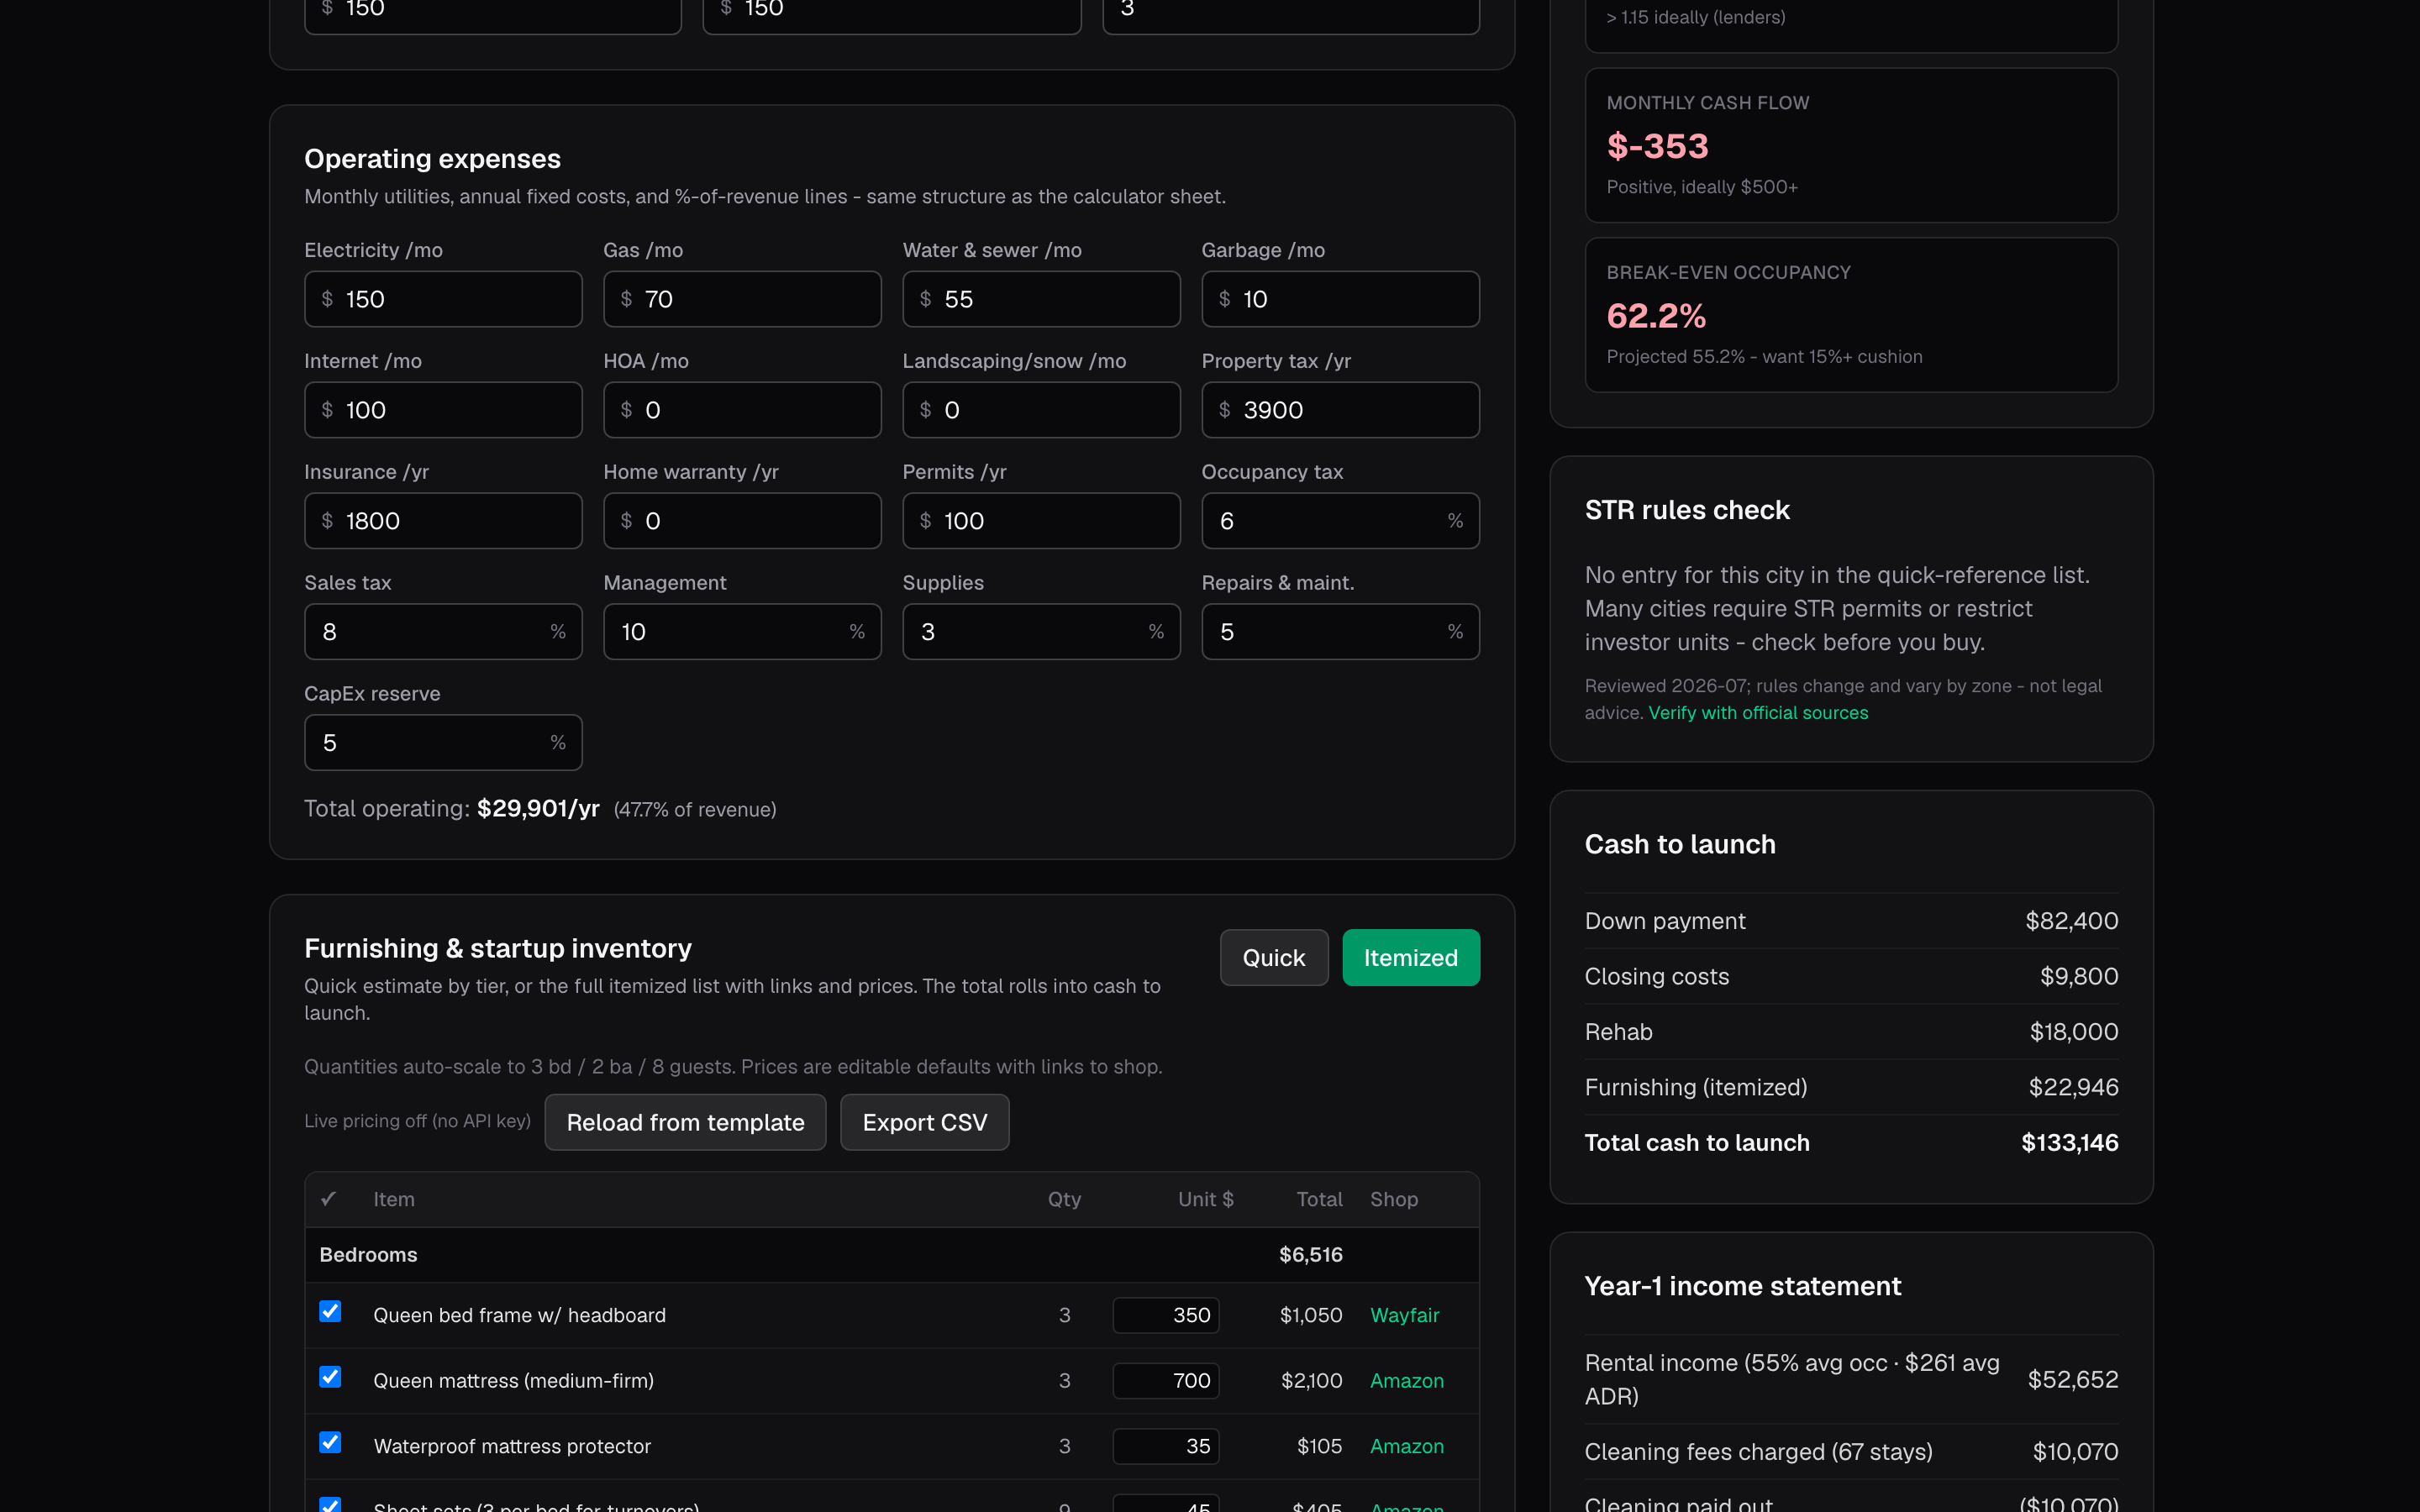
Operating costs, the furnishing inventory, and what it all adds up to before the first booking.
DSCR commercial loan quotes are designed to be hard to compare. A lower rate with higher fees, an interest-only period, a prepayment penalty that only bites if you sell early.
Put every quote for a property into the same model and the differences resolve. The quote that hands over the most cash on the day of closing is routinely not the one that leaves you best off five or ten years later - and that reversal is the whole reason the app exists. It shows both, and the point where they cross.
Because it holds several properties, it can also answer the portfolio-level version of the question: pick the preferred quote on each and see the total.
- Any number of quotes per property, all modelled the same way
- Interest-only periods and prepayment penalties handled properly
- A winner named for each horizon, because they are often different quotes
- A cumulative cash chart that makes the crossover visible
- Exit analysis: what selling or refinancing in a given year actually nets
- Stress testing for a rent drop, more vacancy, or costs rising
- Portfolio roll-up, lender templates, full change history and a lender-ready PDF
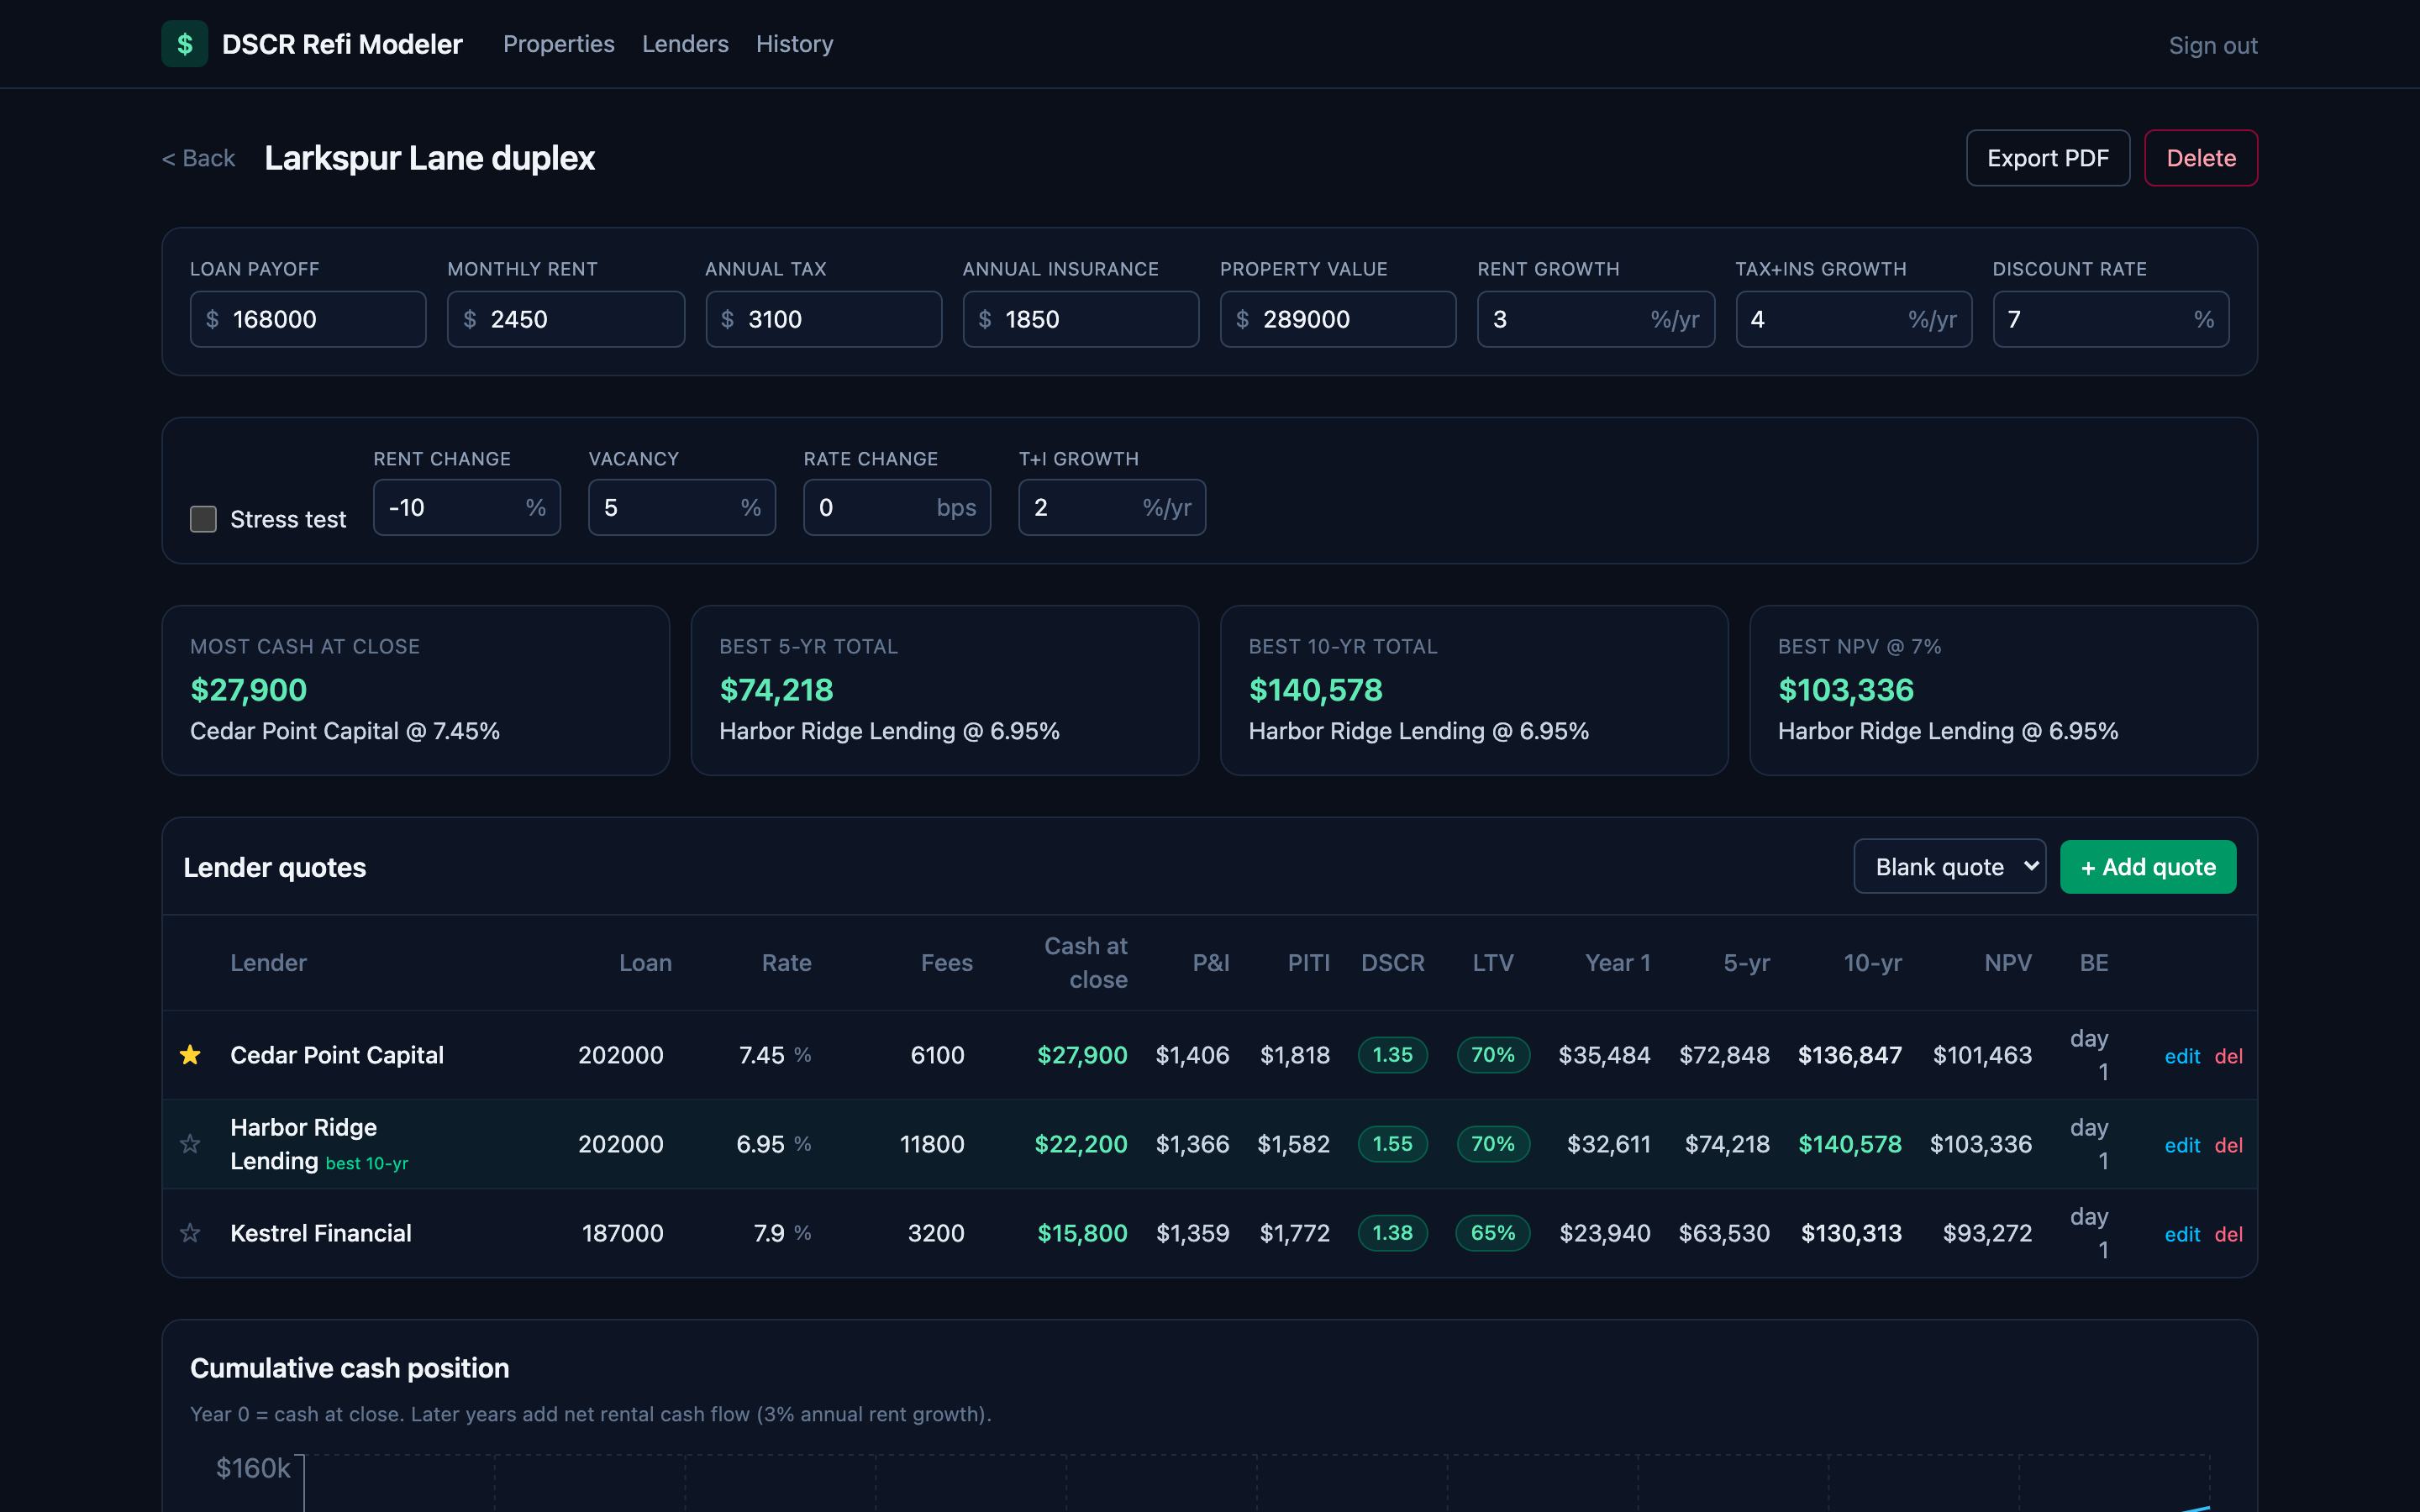
Invented lenders on an invented property. Note the top cards: most cash today is one lender, best over ten years is another.
Most rental calculators answer for year one. Almost every decision that matters - refinance, sell, hold, convert - depends on years five through thirty.
This one projects the whole hold: rent and costs growing at their own rates, the loan amortising, equity building, and what a sale would net in any given year. The same property can be modelled as a long-term let, a mid-term let, a short-term let or a sale, and the four sit in one table to be compared.
It runs entirely in the browser. No account, no server, nothing transmitted - which for someone's whole portfolio was the point.
- A thirty-year projection, year by year
- Several strategies for the same property, compared in one table
- Exit modelling, including what a sale nets after costs and payoff
- A portfolio dashboard across every property held
- Projected tax schedule and an actuals tab to check the model against reality
- Runs locally in the browser, with rolling automatic backups
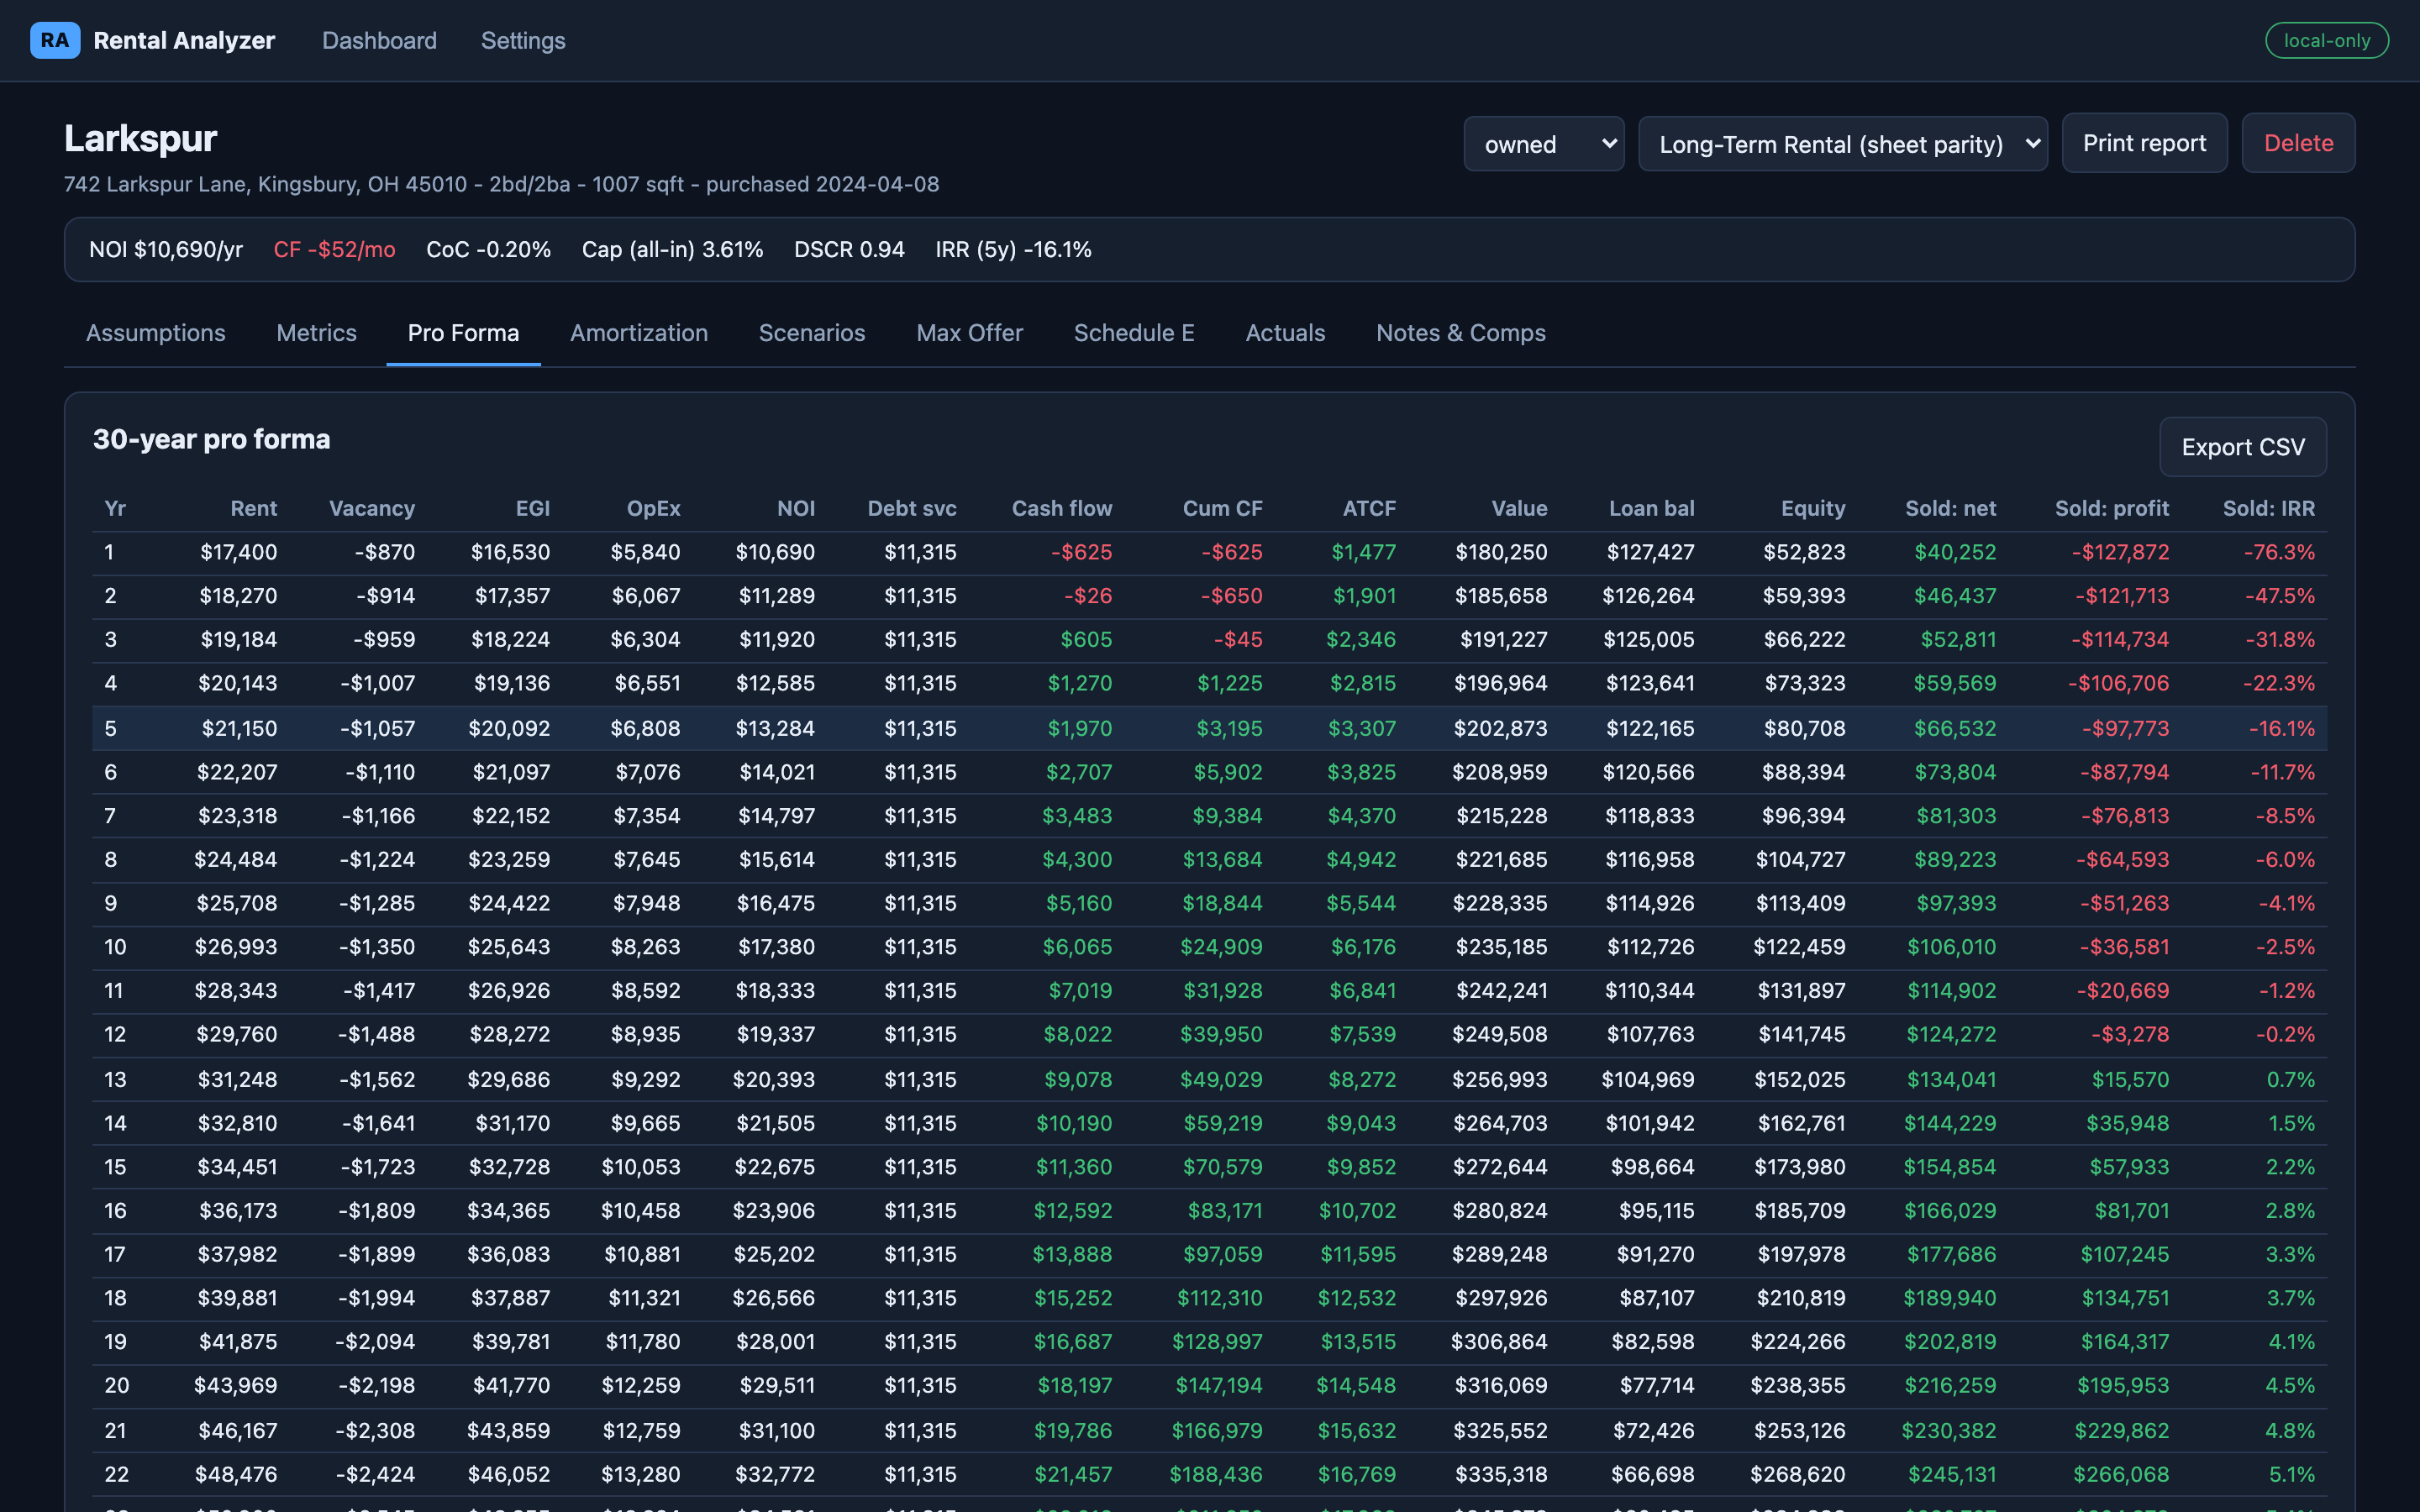
Thirty years of an invented property, at a glance.
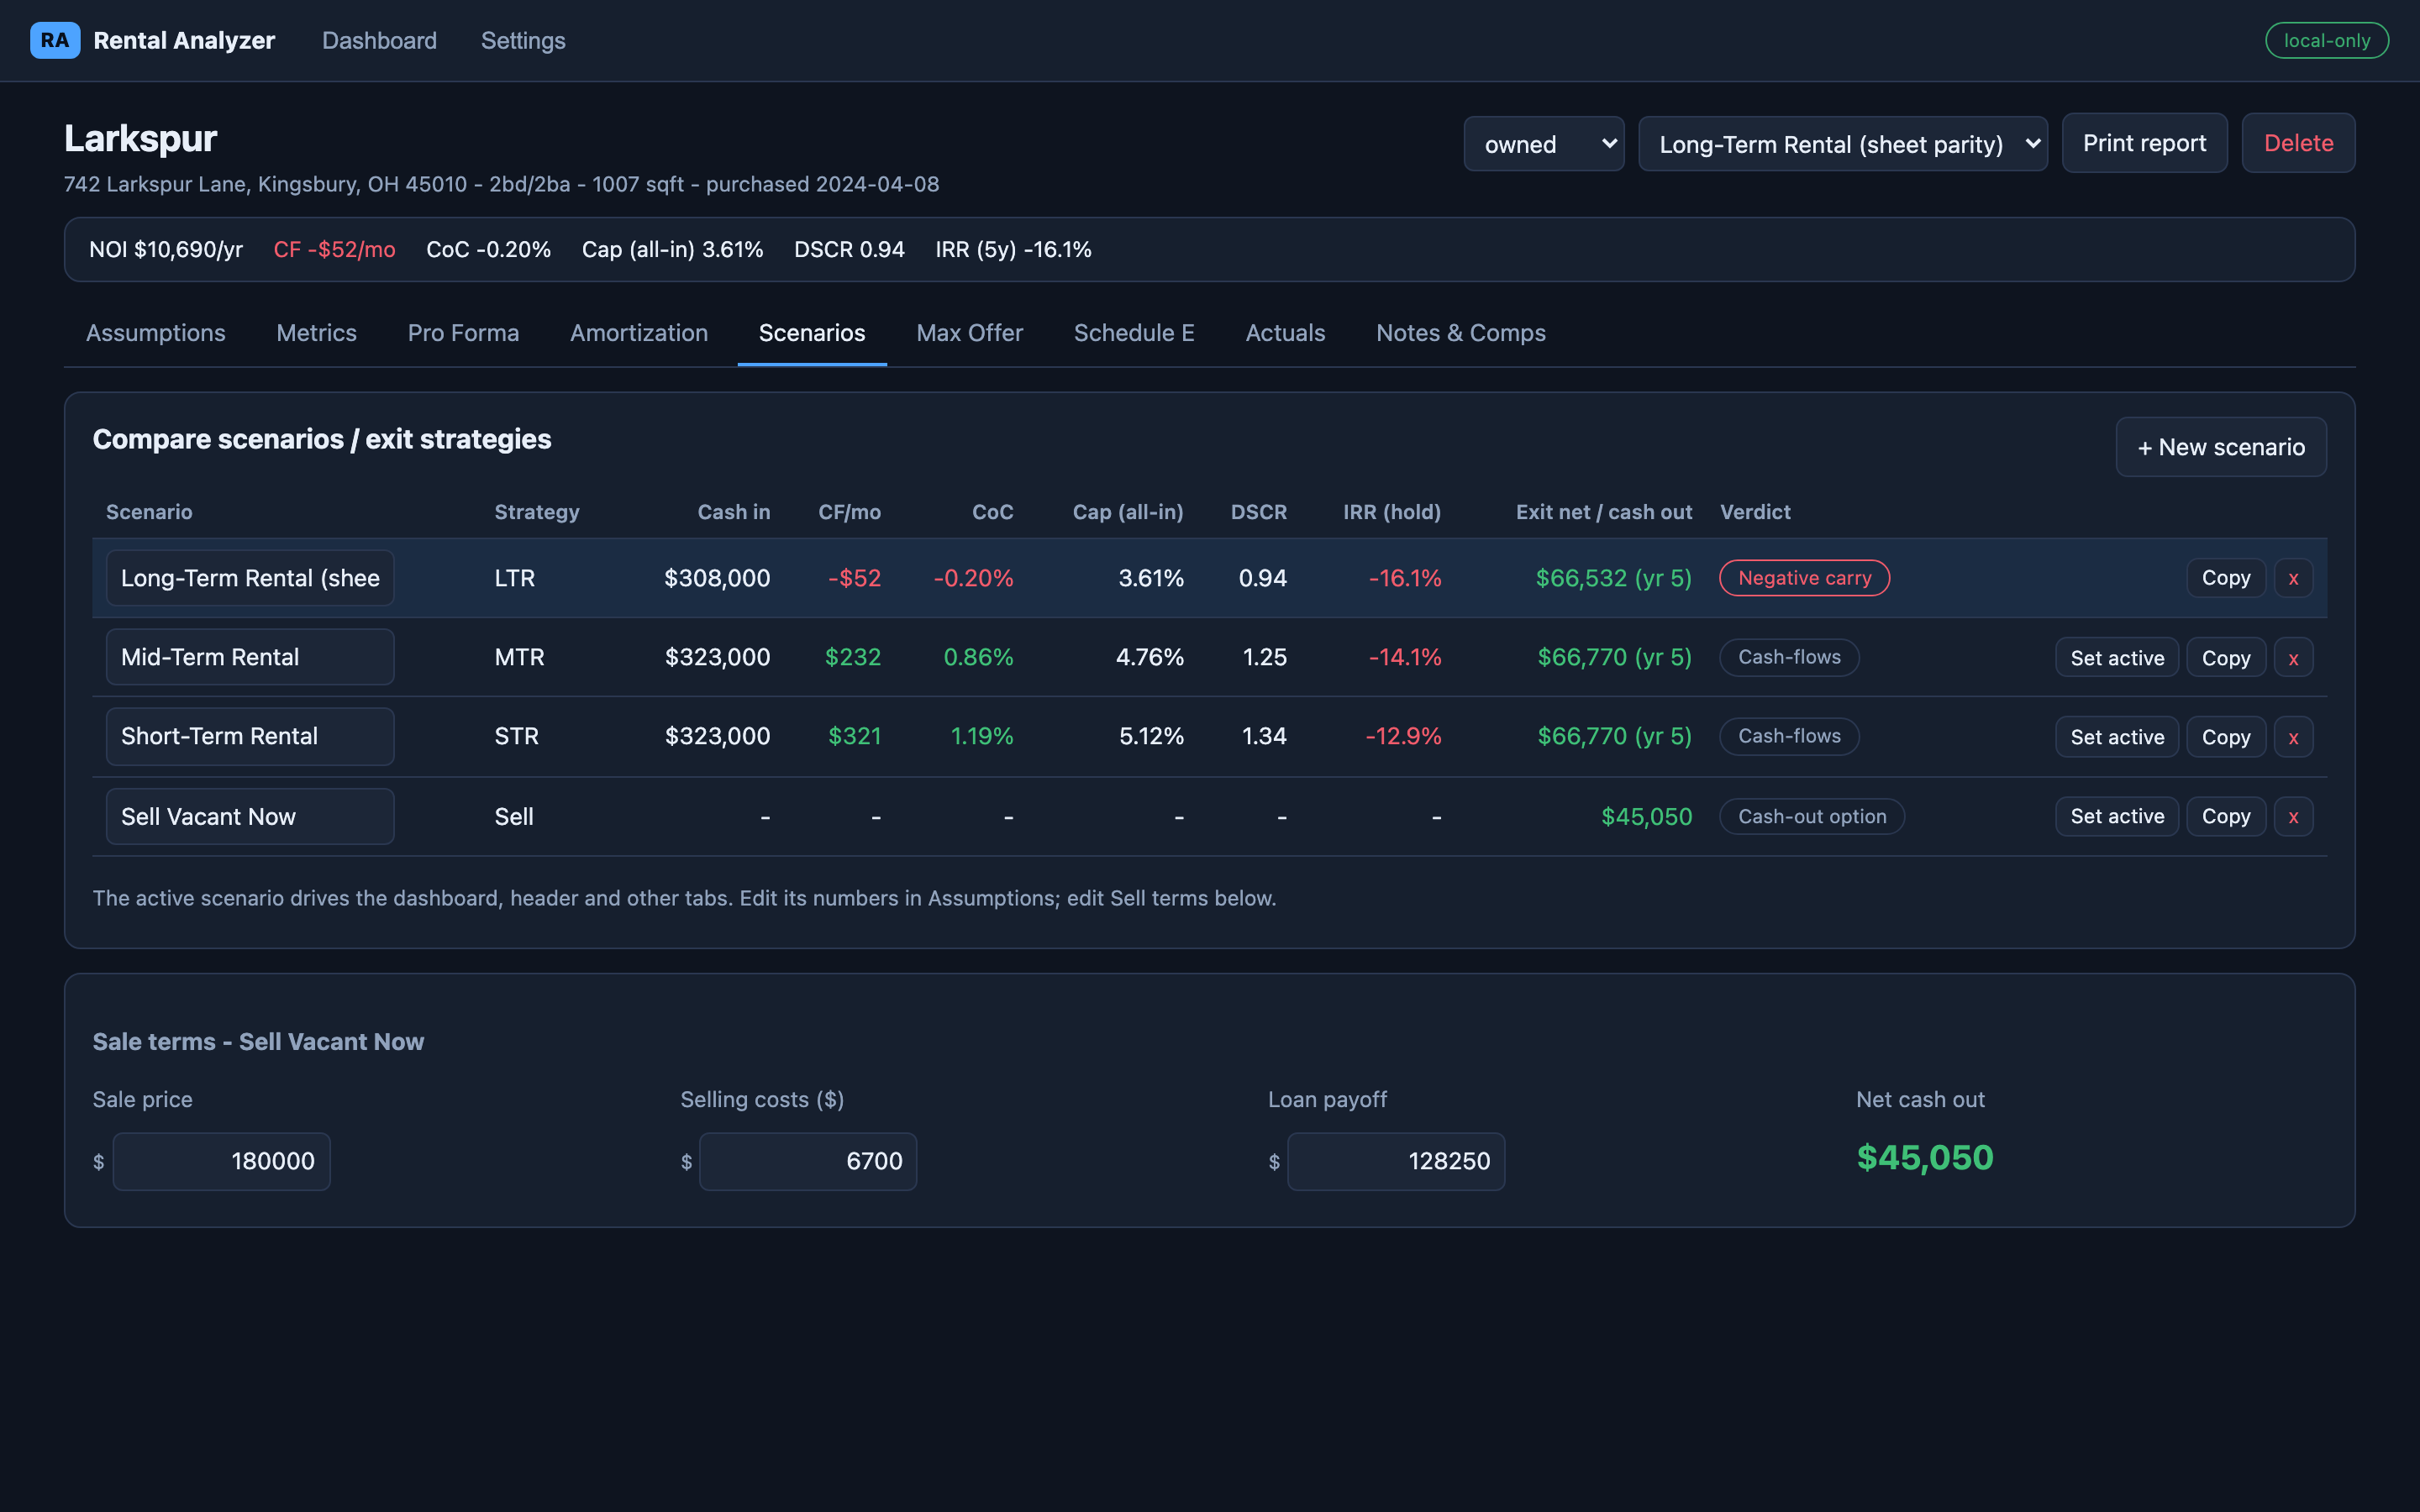
The same property as a long-term let, a mid-term let, a short-term let, or a sale.
How they were built
Five apps that behave like one product.
Built one at a time over several months, each replacing a specific spreadsheet, and each holding to the same handful of rules. That consistency is why they still feel like a set rather than five side projects.
The old sheet is the test
Where an app replaced a spreadsheet, the engine is checked against that sheet's own numbers. If a formula changes, the change has to be deliberate and written down.
The math lives in one place
Every app keeps its calculations in a single engine the interface calls. No number is computed in two places, so no two screens can disagree.
Nothing is lost by accident
Change history with one-click revert, rolling automatic backups, and an export you can take with you.
Local when local is safer
Two of the five never send anything anywhere: the data stays in the browser. That was a deliberate trade of convenience for privacy.
Degrades instead of breaking
Every outside data source is optional. Without a key an app runs on realistic sample data rather than showing an error.
Private by default
Each app is behind a sign-in limited to named people. None of them is a public tool.
Built to be handed over
Every app is a repository with its own documentation and a written changelog. Any of them could be given to another developer tomorrow.
Two more in the same stack
A commercial property manager for rent, service charges and maintenance, and an analytics tool for closed transactions. Not shown here.
Is your business being run out of spreadsheets?
That is usually not a spreadsheet problem - it is a sign the work outgrew the tool. If the same numbers are being retyped between files every week, it is worth an hour to map what a proper tool would look like.
Book a call with David